Community Detection
Forming communities.
Communities are formed through communication networks or are centred around topical conversations. There are multiple ways in which a community can be detected, one of which is through the louvain algorithm in which this exercise would apply. What we would want to achieve here is to identify groups and see if there is any relationship between topics or by staff hierarchy/position. The hypothesis here asks the question, “Are there any relationships between what is talked about against the connectedness of people?” If we were to consider how certain topics revolve around more extroverted groups of people, gossip for instance, a trend is possible. Also equally possible, how accountants are siloed and really should communicate more.
To illustrate these communities we have leveraged Neo4J (N4J), a NoSQL platform which handles network graphs well. More importantly it is able to execute graph algorithms for our use which we would be exporting as a csv for analysis on python.
Don’t mind the Jargon..
The switch between LDA, NLP to graph theory is indeed rather abrupt, and for good reason - we need to understand how the network is distributed and its connectivity to understand possible underlying trends. Let me attempt to shed some light onto perhaps what this all means. Foremost, this is a graph, in the case of graph theory anyways..:
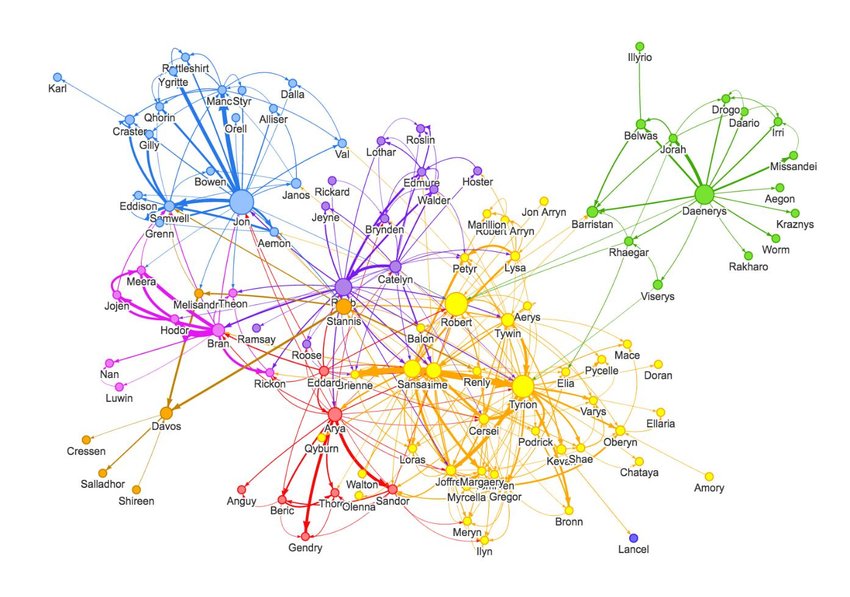
This is not a graph
Graphs come in various flavours, directed, undirected, cyclic, acyclic but in essence, they represent a network and how each player (node) is related to another. This would easily illustrate certain issues clearly such as common connections where it would have otherwise been difficult to identify as part of a table. For more information on graphs, you can check out Neo4J’s website or this.
Back to the program.
Once we have uploaded all our data onto N4J, we are able to do some interesting visualizations and compute various network statistics such as Louvain modularity score, degree, and eigenvector.
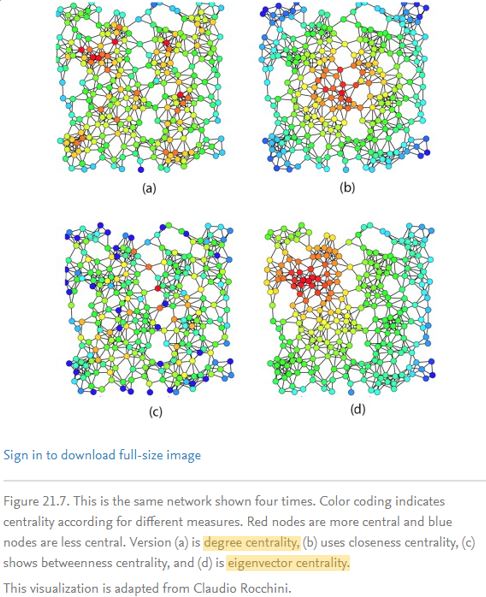
Degree Centrality
To quote Wikipedia:
In graph theory, the degree (or valency) of a vertex of a graph is the number of edges that are incident to the vertex…
Paraphrased: 1) Edges to a node. 2) Connections to a node. 3) Lines connected to the circle.
I think you get the drift here. In essence this measure is to deduce who are the most popular people in the network.
Eigenvector Centrality
I was about to quote Wikipedia yet again, but from a lay person’s perspective I do not think the following is at all helpful.
Eigenvector centrality (also called eigencentrality) is a measure of the influence of a node in a network. Relative scores are assigned to all nodes in the network based on the concept that connections to high-scoring nodes contribute more to the score of the node in question than equal connections to low-scoring nodes. A high eigenvector score means that a node is connected to many nodes who themselves have high scores.
Instead, this explanation is better Source
Eigenvector centrality measures a node’s importance while giving consideration to the importance of its neighbours. For example, a node with 300 relatively unpopular friends on Facebook would have lower eigenvector centrality than someone with 300 very popular friends (like Barack Obama).
Louvain Modularity
While we are able to use centrality scores to assess persons of interest, we are also interested in the communities that are present not from a explicit point of view (e.g. departments, positions) but from an implicit point of view. This interests us as we would be able to identify network connections and adjacencies. We can then check this against popularity (Degree) or by explicit communities (Position) or on a topical basis. Foremost, modularity is defined as the measure of separation of clusters/groups (just in case you were wondering..)
There are quite a number of modularity algorithms to use but one of the fastest (‘scalable’) methods is Louvain which we would be using. In essence, it does a ‘greedy’ assignment of nodes to the community and then it redefines the network accordingly from the initial step, till no more modularity assignments are possible (optimized). Illustrations, for people like me who are just not that good with words..
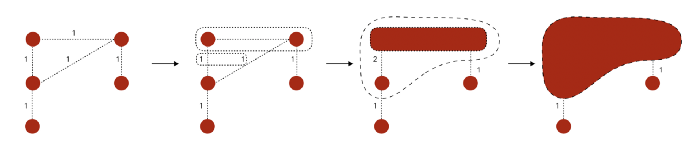
This is too.. Jelak
I hope the above was just a quick taster as to a couple of key topics when it comes to graph theory and it would suffice and better yet, spark interest in this particular field, as I was. We are however, here to see the results of this N4J and note any observations between degree(popularity), position, and topics can be derived. And so, on to the results..
Results.
Degree Centrality
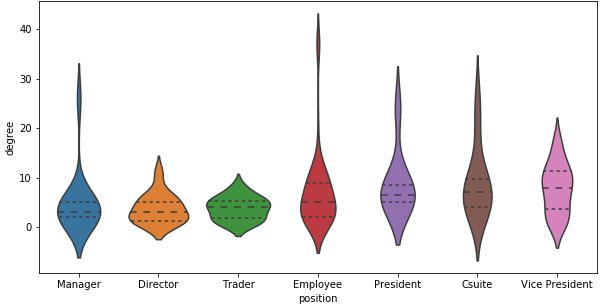
This is likely what we have all expected, but have yet to confirm. We have all heard about the middle management squeeze. This is a clear example of it occurring. Middle management, represented by VPs take the highest popularity/degree score with its median marginally above that of Csuites and ahead those of regular employees.
Eigenvector Centrality
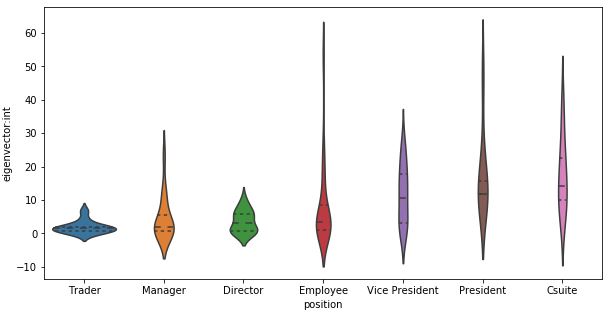
This perhaps is slightly unexpected but heartening to observe. We note from this graph that for the most, the scores follow hierarchical positions. This implies that the efficiency of the network is led by upper management, with Csuites leading. This should be and is well the case as it would be ideal that upper management is able to communicate issues effectively through the network.
Topic, Centrality, Modularity Correlations - by position
Quite the mouthful.
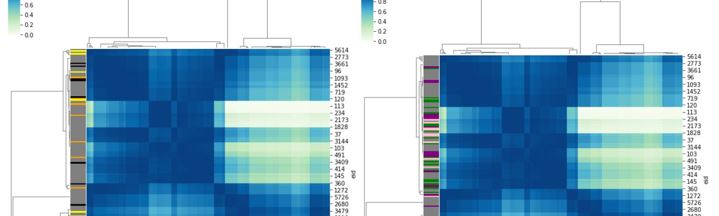
Let us first introduce Topic-Degree Correlation. This works on the hypothesis that people of same topical interest and communication level should be correlated to each other. The results are as shown below and indicates that there are 3 main groups high to loosely correlated groups. It appears that topical and centrality correlation that are of a moderate level tends to fall within the mid-upper management. as shown by the heatmap on the left. This implies a distribution of topics across middle/upper management as opposed to employees that are either task focused or too disparate.
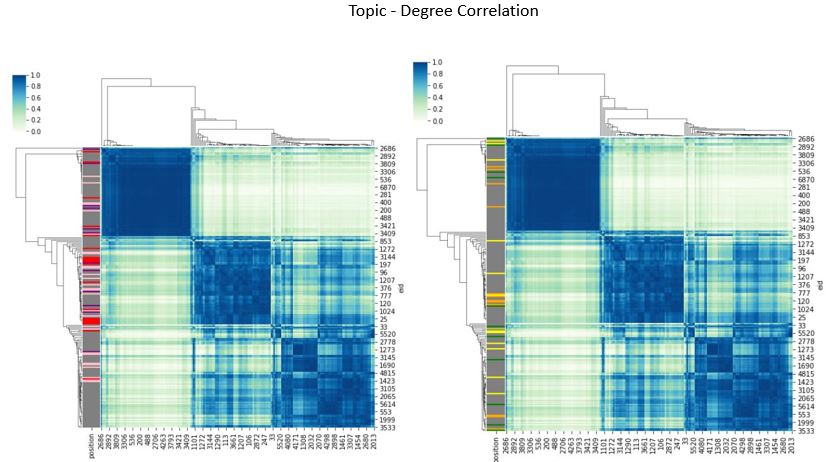
Degree-Louvain Correlation was done to identify if there are any popularity or network efficiency correlations between positions. The results are merely a re-representation of the violin plots above, particularly degree-position. These heatmaps show upper/middle management are highly correlated amongst themselves, much unlike the employee types.
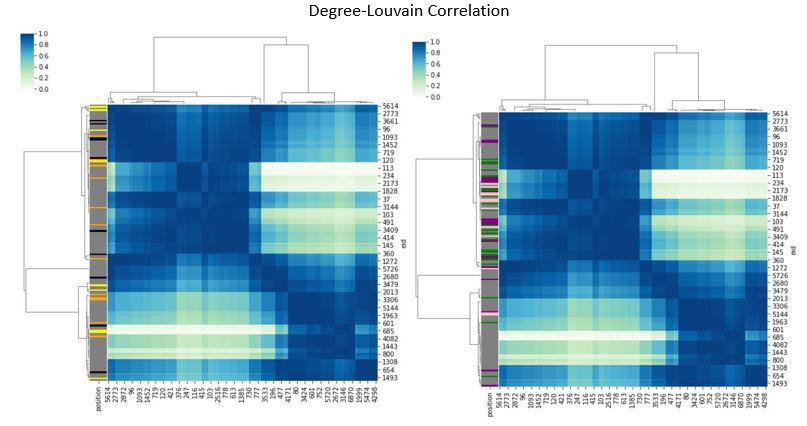
It should also be noted that I have grey-ed out employees as they are the bulk of the positions, colourizing would just cause a mess.
So what do all these tell us? There appears to be a relationship between position and connectivity and topical distribution of middle and upper management. This lays an overall understanding of how this corporation is structured and it would be interesting to observe on a enterprise or team level how such networks differ from each other. As a whole, it does appear to confirm some intuitive knowledge of how businesses are operated, and as such good to confirm such knowledge.
Being empowered with the general themes, we would next delve into the individual, his/her network effect, in paricular we would like to highlight the 2 main people in the scandal, skilling-j and lay-k.